Expectations management
TODAY, WE VISIT THE DEPARTMENT OF CORRECTIONS
A department is defined as a distinct part of anything arranged in divisions; a division of a complex whole or organized system. Market behavior can be divided into departments as well. The bull department is characterized by long periods of higher prices, which are irregularly interrupted by brief periods of quickly falling prices (the bear department ). We have just gone through a mini-bear department, a so-called correction. Maybe. Or maybe we aren’t done yet and the market will fall further. Nobody knows, it’s not really the topic of this post. But corrections are interesting. This post specifically deals with the following:
How common are corrections?
How large are they typically and what year-end returns tend to accompany corrections of various magnitudes?
What should we expect as stock market investors in terms of drawdowns over various time horizons?
“I HAD A DIFFICULT CHILDHOOD…”
When I started in this business in 2007, volatility was very low. It was a good time to be in the stock market. Since the bull market started in 2003, there had been only very brief bouts of volatility, and anyone who wasn’t fully invested in the market was an idiot. Sure, there had been a brief scare in May 2006, but otherwise, things were generally only heading up and to the right. Volatility began to increase as 2007 progressed, but the market kept going up until September. Then, just as I was starting out, things started to go sideways. Slowly at first…then quickly. By the fall of 2008, things were bad, so pitch black in fact that I think it’s hard to comprehend if you weren’t working in the markets at the time (I was a broker at the time, thankfully - if I thought I was feeling miserable, I imagine being a portfolio manager was ten times worse).

VIX 2003-2007
Pretty smooth sailing…until it wasn’t
THE CONCEPT OF IMPRINTING
The market didn’t stop falling until March of 2009. By that time, I had quit my job as a broker (I top ticked the start of my broker career, bottom ticked the exit) and gone back to school. The experience of a full blown bear market stays with you. In hindsight, it’s obvious that it colored the way I looked at investing for a long time. I became very, very risk averse there for a while.
I started working on the buy side in 2010, and the GFC stayed with me throughout those early years. I started as an analyst, obsessed with adjusting for “the full cycle ” which always included the GFC years, never finding anything cheap enough. Later I became a co-PM, still quite gun shy. I would only touch ridiculously cheap stuff (some people are great at this, I don’t think it’s a great strategy personally) and missed many great opportunities as a result. It took years to shake the fear instilled in me by the GFC.
I think we are all influenced by our early experiences in the market, one way or the other. I mostly have to overcome a deeply ingrained bearishness personally. It’s like Konrad Lorenz’ idea of imprinting. Imprinting occurs when an animal, for example a gosling, forms an attachment to the first thing it sees upon hatching. Lorenz discovered that newly hatched goslings would follow the first moving object they saw. Sometimes, that object was Lorenz, and the little birds would follow him around wherever he went. That first connection with the world is lasting and hard, if not impossible, to reverse later.
Emotions are difficult to control. And while suffering from financial crisis-PTSD, it was difficult for me to objectively assess the likelihood of another correction or bear market occurring. I’m not alone in this, it’s not particularly difficult to find examples of the same type of behavior from market participants, whether from permabulls or permabears. Some are still beating the doomer drum, more than 15 years later.

2007-2009
Ouch
HOW DO CORRECTIONS TYPICALLY IMPACT YEAR-END RETURNS?
Charlie Bilello recently tweeted about this. The table shows the S&P 500’s maximum intra-year drawdown for every year since 1928:
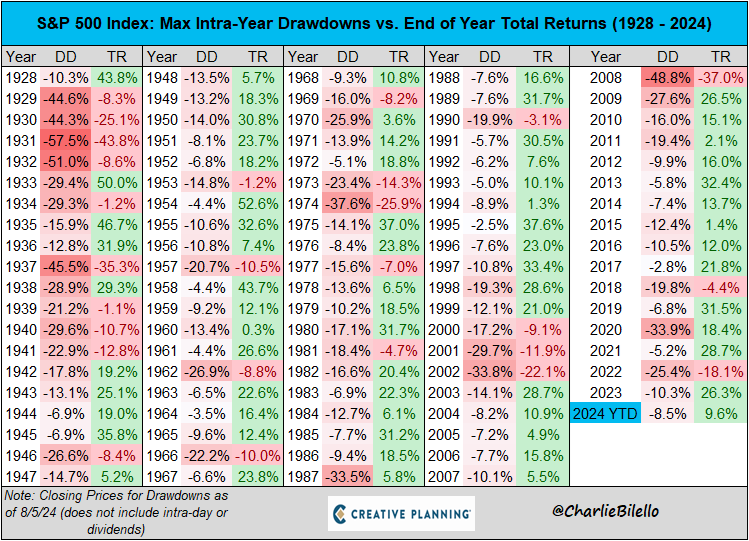
Bilello writes:
“The price of admission for receiving the S&P 500’s long-term total return of 10% is suffering through many drawdowns along the way. The current 8.5% drawdown on a closing basis is just the latest in a never-ending series of tests, and it’s actually a mild one at that. The median intra-year drawdown since 1928 is -13%.” Source: https://bilello.blog/2024/the-week-in-charts-8-5-24
A correction like the one we just witnessed is completely ordinary, in other words. Using Bilello’s data set, we can calculate the median annual drawdown and the median annual return, -12.9% and 15.1% respectively. Let’s divide the drawdowns into different buckets: one for drawdowns below 10%, one for drawdowns between 10 and 20%, one for drawdowns between 20 and 30% and one for drawdowns larger than 30%. We might want to consider what typical annual return we can expect depending on the severity of the drawdown. The results are displayed in the chart:
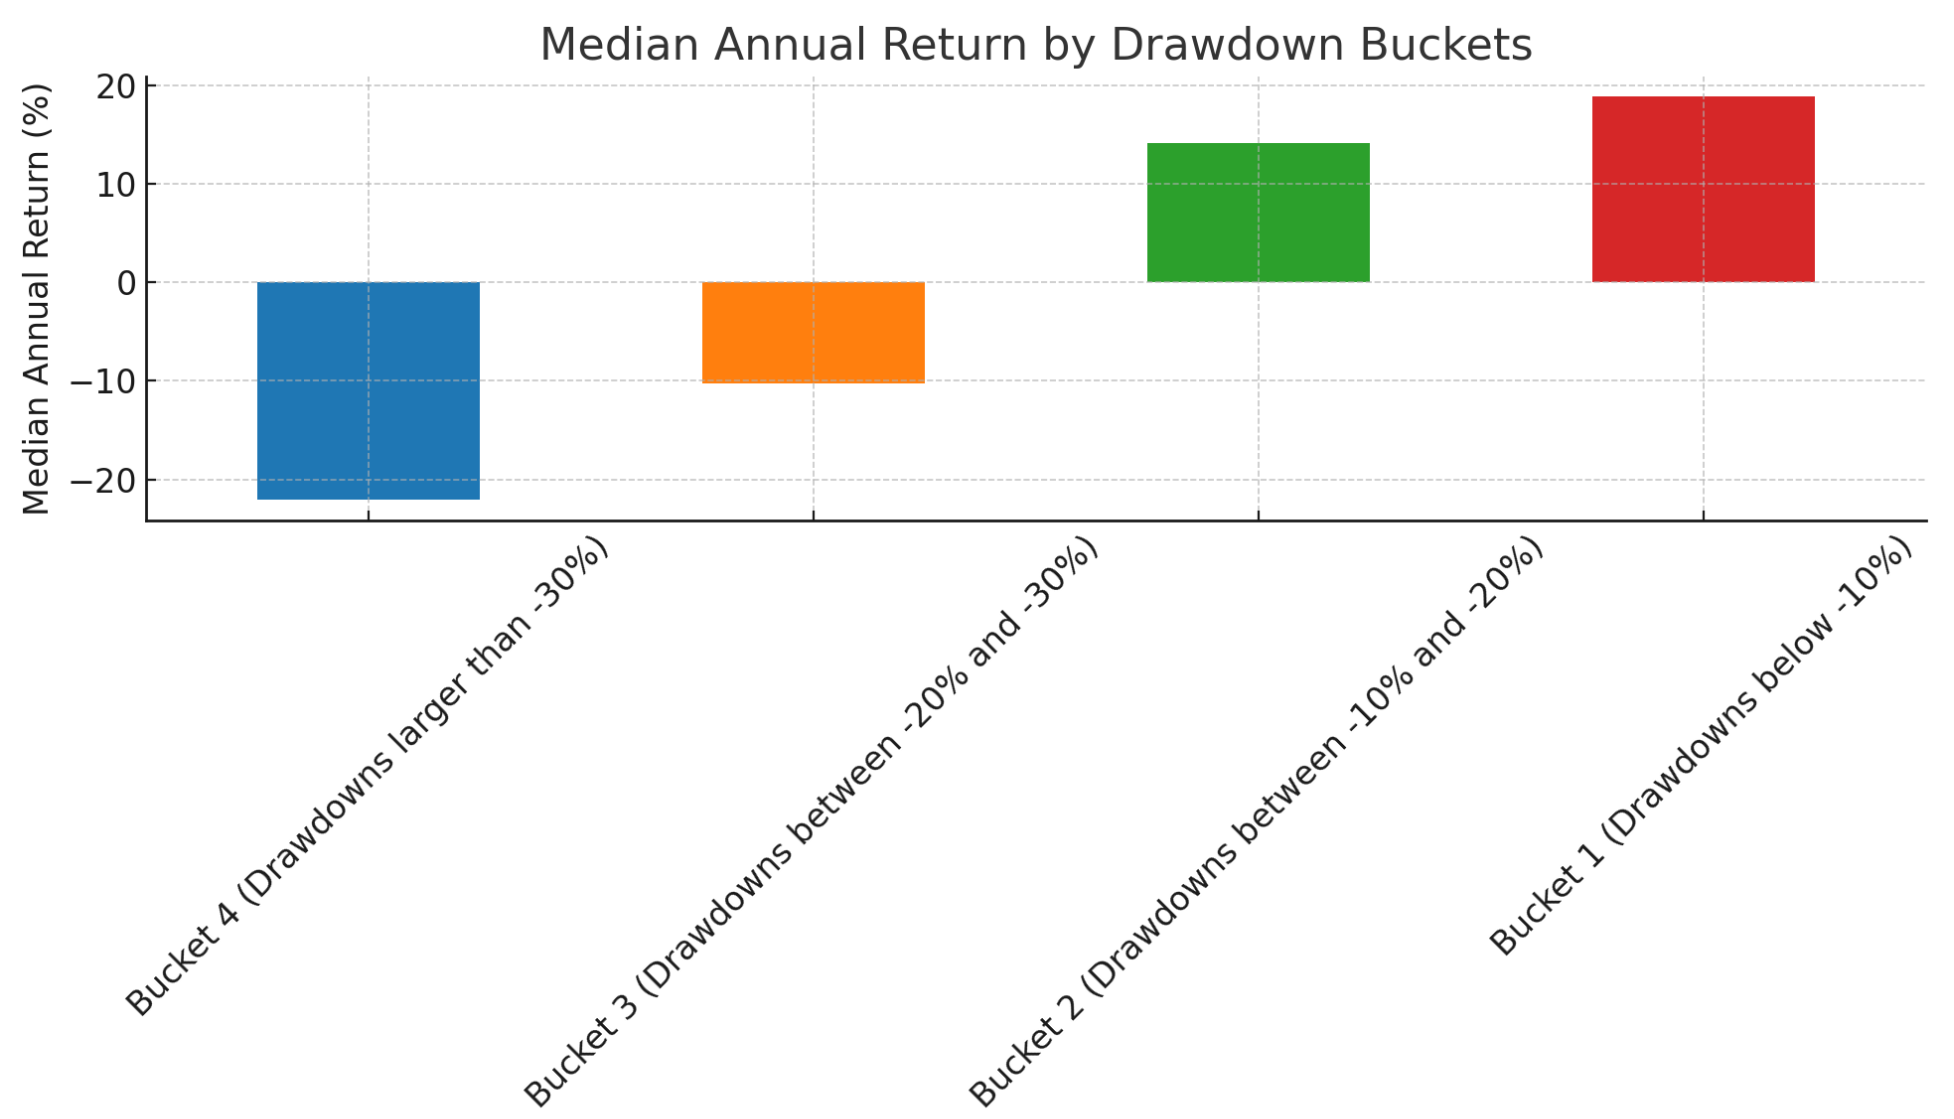
Smaller drawdowns are usually indicative of better year end returns - duh.
But it seems like even the worst drawdowns typically don’t result in the annual return being all that terrible though. Even drawdowns above 30% typicall only lose about 20% in a year. Not that bad?
HOW LIKELY IS A CORRECTION OVER A GIVEN TIME FRAME?
One way of performing an assessment of the likelihood of a correction or bear market over some time frame t is to consider market history and assume it is representative of what to expect in the future. Using that data, we could create a base rate probability for a correction occurring over some specified time period.
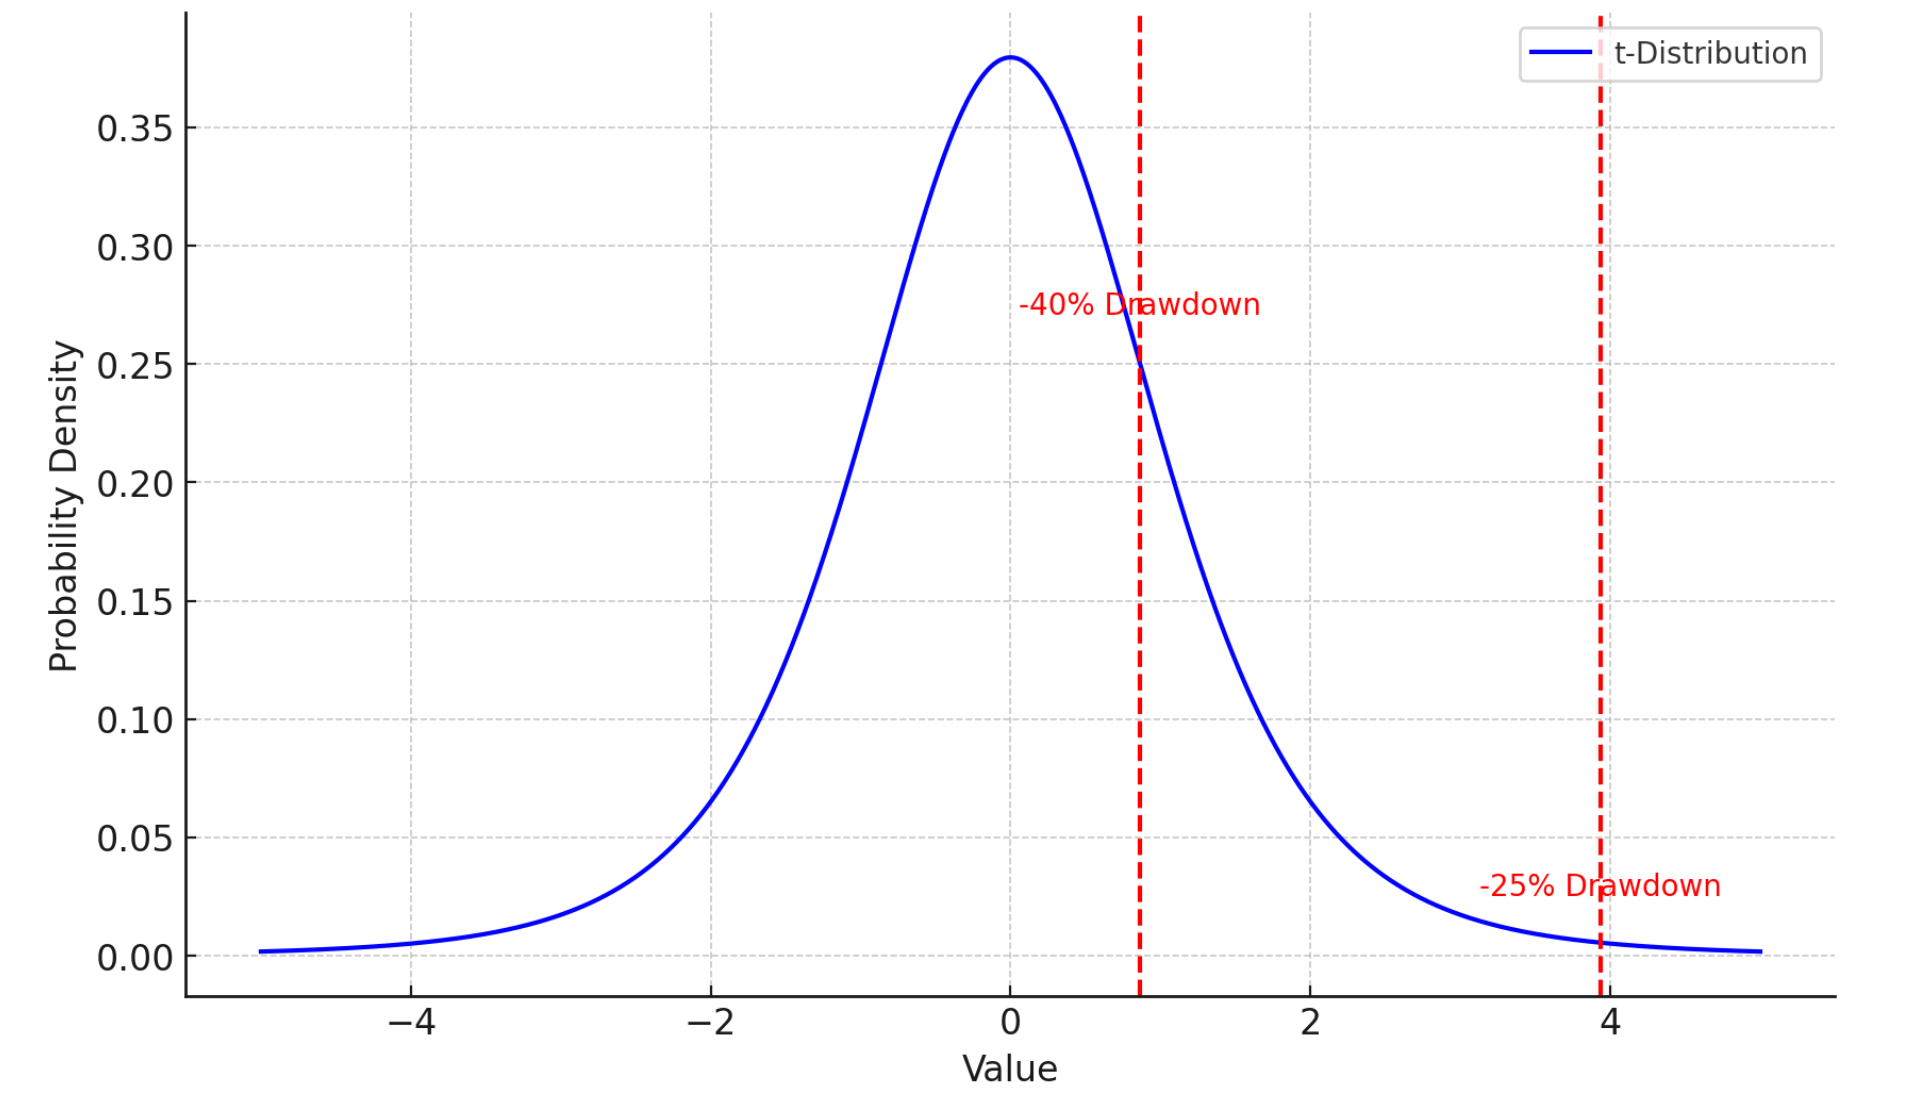
I’m going to use monthly return data for the OSEBX Index in this calculation. To estimate the probability of experiencing drawdowns of varying magnitude (I’m choosing 10%, 25% and 40% here), we’ll calculate the mean monthly return and standard deviations and perform a Monte Carlo simulation (10k draws w/ replacement). We’ll assume the data are consistent with a t-distribution instead of a normal distribution to account for the heavier tails typically observed in financial data (df =5).
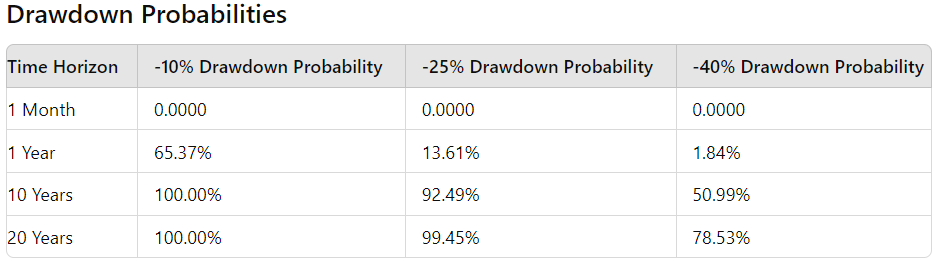
Caveat lector: The table above is a representation of probabilities based on a MC simulation with 10.000 draws. A model such as this has limitations, it’s just a map we use to navigate, not the territory! The model claims the probability of a 10% drawdown in a month is 0, but in real life (which is where most of us operate), a -10% drawdown or worse actually occurred 8 different times over the last 20 years for the OSEBX Index, or in 3.3% of the months.
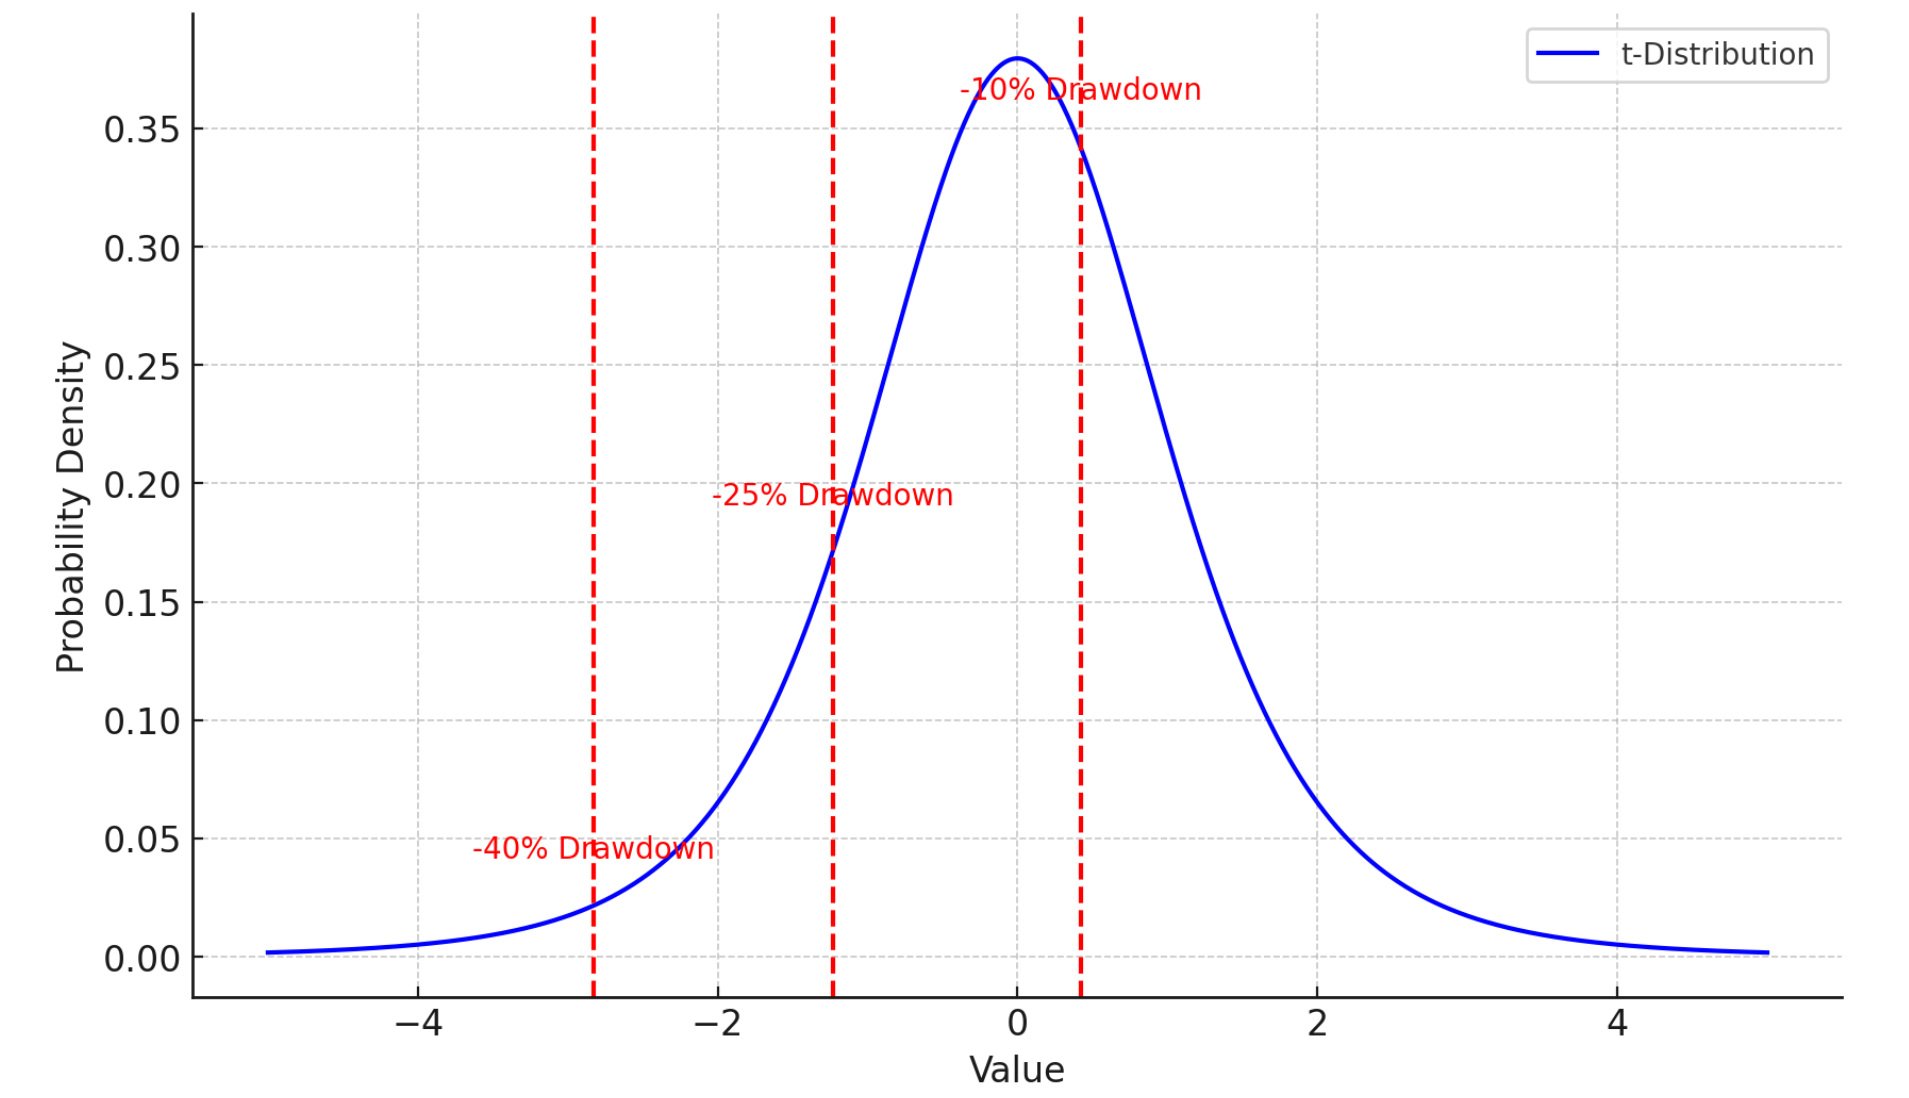
The first graph (above) shows the probability of drawdowns of the different magnitudes in a 1 year time period.
(The "value" on the x-axis of the t-distribution graph represents the standardized drawdown magnitude in units of standard deviations away from the mean of the distribution (which is 0). In financial terms, the x-axis value tells you how extreme a particular drawdown is relative to the average fluctuation (standard deviation) of returns).
The graph above shows the drawdown probabilities over a 20 year timeframe.
TAKE-AWAYS:
Over a single year, the probability of a drawdown of at least -10% is very high, almost 66%. We should expect to see one without breaking a sweat. The probability of a large drawdown of -25% is by contrast quite low, only about 13.5%. Suffering a -40% drawdown in a given year is very unlikely. That being said, this excercise was based on a simulation of historical data, there is no guarantee that the market’s behavior is limited to that seen in the dataset to date. On the other hand: if you play this game long enough, having to live through a -25% drawdown is a virtual certainty, and experiencing a big bad -40% bear is very likely.
Now you know what to expect. Plan accordingly. Chance favors the prepared mind, as the saying goes.